
The intelligent ecosystem for the photovoltaic industry
Enter your address to receive your solar 3D plan and savings estimate.
Example: 10 OX4 7RU
Explore the UK Rooftop Solar Value Index
Compare solar potential, estimated household savings and payback across the UK.
Why homeowners choose GreenSketch
Unlock your roof's potential to maximise savings, go green, and connect with trusted installers.

Smart ROI Estimates
Explore realistic payback periods and potential savings, dynamically modeled using local utility data and your roof's unique profile.

A Greener Future
Join the renewable energy movement. Harnessing the Sun's power on your roof plays a crucial role in building a low-carbon world for tomorrow.
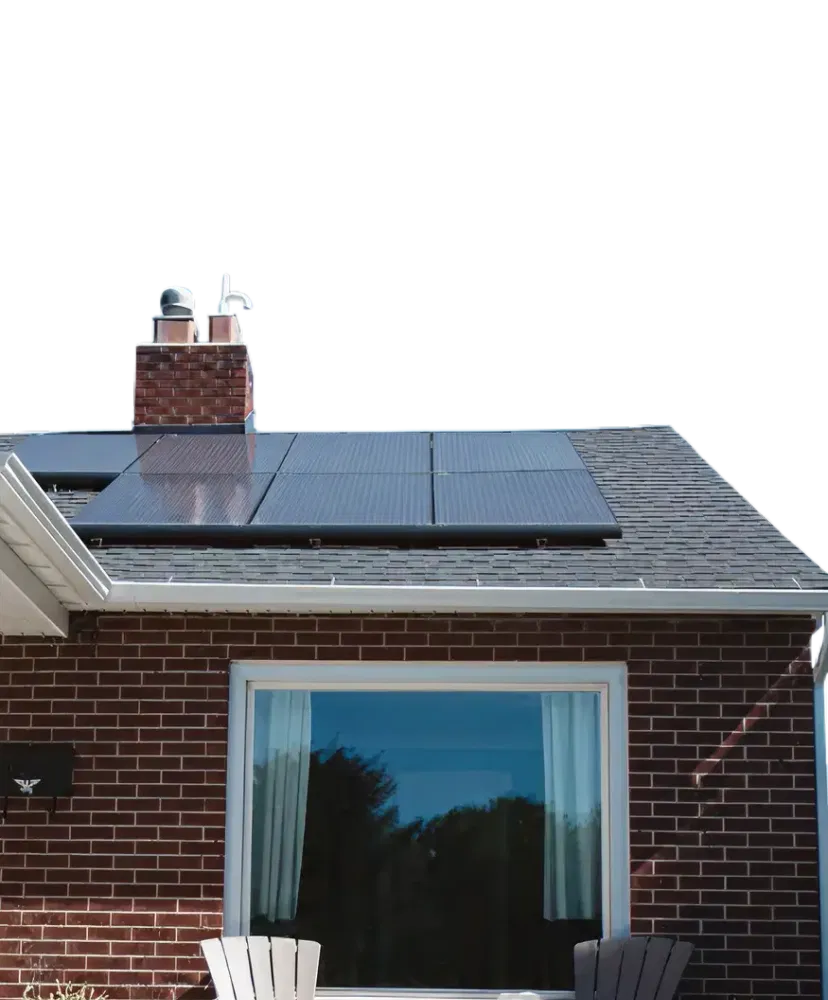
Trusted Connections
Armed with our objective AI assessment, you can confidently connect with local installers to better evaluate your real-world options.
Location Performance Rankings
Comparing Key Metrics Across the United Kingdom
DAILY GENERATION
Unit: kWh/Day
PAYBACK PERIOD
Unit: Years
ANNUAL YIELD (First Year)
Unit: GBP
INTERNAL RATE OF RETURN
Year Projection
DAILY YIELD PER kW
Unit: kWh
20Y RETURNS
GBP, net of upfront cost
Grow Your Solar Business in United Kingdom
Capture high-intent leads with Emily’s AI and streamline your workflow with GreenSketch’s all-in-one design and quoting tools.
Fast Design
3D PV & battery layouts
Quick Quotes
Real-time pricing & margins
Smooth Delivery
Effortless proposals & procurement